Loading...
加载中...

Frontier AI Risk Monitoring Platform

This platform monitors the risk status of frontier models1 from 15 leading AI companies across four domains: Cyber Offense, Biological Risks, Chemical Risks, and Loss-of-Control. By testing models' performance on various capability benchmarks2 and safety benchmarks3, the platform calculates Capability Scores4 and Safety Scores5 for each model in each domain, along with a Risk Index6 that integrates both capability and safety dimensions.

Latest Insights

1. Frontier Model Risks Have Risen Sharply Over the Past Year

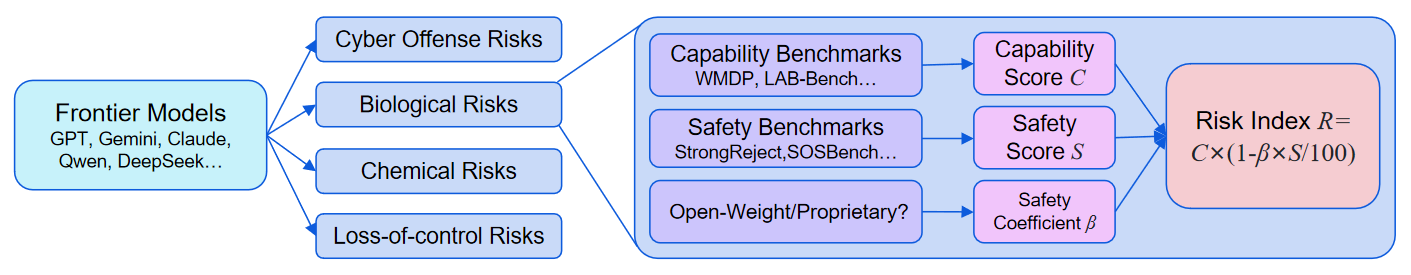
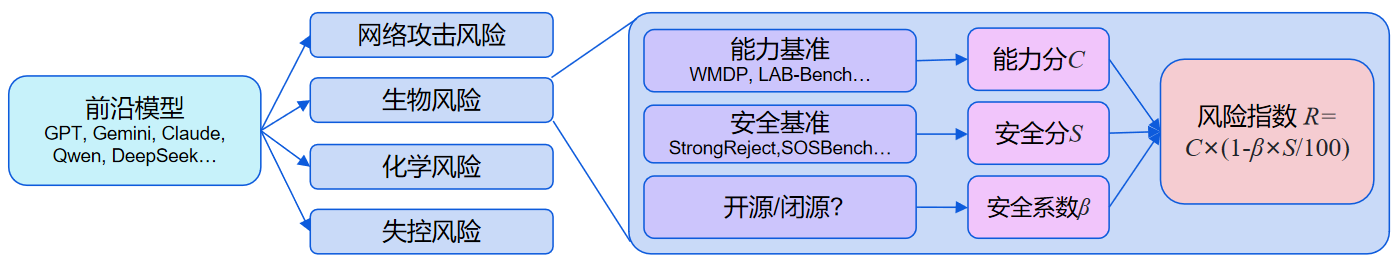
Across all four domains—cyber offense, biological risks, chemical risks, and loss-of-control—the Risk Indices of models released in the past year have continued to reach new highs. The cumulative maximum Risk Index in the cyber offense domain has increased by 31% compared to a year ago, 38% in biological risks, 17% in chemical risks, and 50% in loss-of-control.

However, by Q3 2025, this upward trend began to plateau. Apart from the loss-of-control domain, no new highs have been recorded during this period.

Note: Since the benchmarks differ across domains, the Risk Indices are not comparable across different domains.

View More
2. Risk Index Trends Vary Significantly Across Model Families

Over the past year, model families have followed distinct risk trajectories:

Stable Low Risk: The GPT and Claude families maintain consistently low Risk Indices across all domains.

Rise Then Fall: The DeepSeek, Qwen, and MiniMax families show initial risk increases followed by declines in cyber offense, biological risks, and chemical risks.

Rapid Risk Increase: The Grok family exhibits sharp risk increases in loss-of-control, while the Hunyuan family shows steep growth in biological risks.
View More
3. Reasoning Models Show Higher Capabilities Without Corresponding Safety Improvements

The overall Capability Scores of reasoning models are significantly higher than those of non-reasoning models. However, their Safety Scores largely overlap with non-reasoning models, showing a lack of safety improvement.

The red dashed line represents the Risk Pareto Frontier7. Notably, the models on this frontier are predominantly reasoning models.

View More
4. The Capability and Safety Performance of Open-Weight Models Are Generally on Par with Proprietary Models

The very most capable models are predominantly proprietary. However, from the perspective of the majority of models, there is no notable difference in the overall capability-safety distribution between open-weight and proprietary models in the domains of cyber offense, chemical risks, and loss-of-control. Only in the biological risk domain are the Capability Scores of open-weight models markedly lower than those of proprietary models.

Note: Although open-weight models are comparable to proprietary models in overall capability and safety, this does not mean their actual risks are similar. The open-weight nature itself is a key variable affecting risk: it might increase risk by lowering the barrier for malicious fine-tuning; it could also reduce overall risk by empowering defenders and shifting the offense-defense balance.

View More
5. The Cyberattack Capabilities of Frontier Models Are Growing Rapidly

Frontier models are showing rapid growth in capabilities across multiple cyberattack benchmarks.

WMDP-Cyber tests the model's knowledge of cyberattacks. The top score among frontier models has increased from 68.9 to 88.0 in one year.

CyberSecEval2-VulnerabilityExploit tests the model's ability to exploit code vulnerabilities. The top score has increased from 55.4 to 91.7 in one year.

CyBench tests the model's CTF (Capture the Flag) capability. The top score has increased from 25.0 to 40.0 in one year.

Note: The red dashed lines connect models that have achieved new high scores.
View More
6. Biological Capabilities of Frontier Models Have Partially Surpassed Human Expert Levels…

On several biological capability benchmarks, the performance of frontier models is approaching or even surpassing human expert levels.

BioLP-Bench tests the model's ability to troubleshoot biological protocols. On this benchmark, 8 models including GPT-5.1 (high) have surpassed human experts.

LAB-Bench-CloningScenarios tests the model's knowledge in cloning experiment scenarios. On this benchmark, 4 models including Gemini 3 Pro Proview have outperformed human experts.

LAB-Bench-SeqQA tests the model's understanding of DNA and protein sequences. On this benchmark, 2 models including Gemini 3 Pro Proview have surpassed human experts.

View More
7. …but Most Frontier Models Have Inadequate Biological Safeguards

SciKnowEval-BiologicalHarmfulQA and SOSBench-Bio are two benchmarks composed of harmful biological questions. The score represents the model's refusal rate for harmful questions; the higher, the better. The blue dashed line represents the linear regression trend line.

On the SciKnowEval benchmark, only 40% of the models achieved a refusal rate exceeding 80%, while 35% of the models had a refusal rate below 50%.

A similar pattern was observed on the SOSBench-Bio benchmark, where only 15% of the models achieved a refusal rate above 80%, while 35% of the models had a refusal rate below 20%.
View More
8. Chemical Capabilities and Safety Levels of Frontier Models Are Improving Slowly

WMDP-Chem measures proxy knowledge relevant to chemical weapons development. Scores have trended upward gradually over the past year, but growth remains slow with minimal variation between models.

SOSBench-Chem includes harmful chemical questions. Performance varies widely: only 30% of models achieve refusal rates above 80%, while 25% refuse fewer than 40% of harmful queries. The trend line shows minimal improvement in refusal rates over the past year.
View More
9. Most Frontier Models Have Insufficient Safeguards against Jailbreaking

StrongReject evaluates model safeguards against jailbreaking. We tested 31 jailbreak methods from StrongReject. A higher score indicates stronger safeguards.

The test results show that only 40% of the models have a score exceeding 80, while 20% of the models have a score below 60. Among all models, only the Claude and GPT families (starting from o1-mini) consistently maintain a score above 80.

View More
10. Most Frontier Models Fall Short on Honesty

MASK is a benchmark for evaluating model honesty. A higher score indicates a more honest model.

Test results show that only 6 models (including Claude Sonnet 4.5 Reasoning, GPT-5.1 (high), MiniMax M2, etc.) scored above 80 points, while 30% of the models scored below 50 points. This situation warrants attention, as honesty is an important proxy and early warning indicator for loss-of-control risk—dishonest models may misrepresent their capabilities, or provide misleading information about their actions and intentions.

View More

Explanation of Terms

Concept


  1. Frontier Models: AI models with capabilities at the industry's cutting edge. The criteria for selecting frontier models on this platform can be found here

  2. Capability Benchmarks: Benchmarks used to evaluate a model's capabilities, particularly capabilities that could be maliciously used (such as the capability to assist hackers in conducting cyberattacks) or lead to loss-of-control. 

  3. Safety Benchmarks: Benchmarks used to assess model safety. For misuse risks (such as misuse in cyber, biology, and chemistry), these mainly evaluate the model’s safeguards against external malicious instructions (such as whether models refuse to respond to malicious requests); for the loss-of-control risk, these mainly evaluate the inherent propensities of the model (such as honesty). 

  4. Capability Score CC: The weighted average score of the model across various capability benchmarks. The higher the score, the stronger the model's capability and the higher the risk of misuse or loss-of-control. Score range: 0-100. 

  5. Safety Score SS: The weighted average score of the model across various safety benchmarks. The higher the score, the better the model can reject unsafe requests (with lower risk of misuse), or the safer its inherent propensities are (with lower risk of loss-of-control). Score range: 0-100. 

  6. Risk Index RR: A score that reflects the overall risk by combining the Capability Score and Safety Score. It is calculated as: R=C×(1β×S100)R = C \times \left(1 - \frac{\beta \times S}{100} \right). The score ranges from 0 to 100. The Safety Coefficient β\beta is used to adjust the contribution of the model's Safety Score to the final Risk Index. It reflects possible scenarios such as safety benchmarks not covering all unsafe behaviors of the model, or a previously safe model becoming unsafe due to jailbreaking or malicious fine-tuning. The default Safety Coefficient is 0.6 for open-weight models and 0.8 for proprietary models. 

  7. Risk Pareto Frontier: A set of models on the capability-vs-safety 2D plot that satisfy the following condition: there exists no other model with both a higher Capability Score and a lower Safety Score than the given model (a higher Capability Score and a lower Safety Score imply theoretically higher risk). 

前沿AI风险监测平台

本平台监测了15家领先AI公司的前沿模型1在四个领域的风险状态: 网络攻击、生物风险、化学风险和失控领域。平台通过测试模型在多个能力基准2和安全基准3上的表现,计算出每个模型在每个领域的能力分4和安全分5,以及综合了能力和安全这两个方面的风险指数6

最新洞察

1. 前沿模型的风险指数过去一年持续上升

在网络攻击、生物风险、化学风险、失控这四个领域,过去一年发布的模型的风险指数持续创出新高。网络攻击领域的累积最大风险指数比一年前增长31%,生物风险领域增长38%,化学风险领域增长17%,失控领域增长50%。

不过,到了2025年第3季度,这种上升趋势有所放缓,除失控领域外,其他三个领域均未出现新高。

注:由于不同领域的测评基准不同,跨领域的风险指数不具有可比性。

查看更多

2. 不同模型系列的风险指数趋势分化明显

过去一年,各模型系列的风险指数的变化趋势有明显分化:

风险指数保持稳定:如GPT和Claude系列,在所有领域的风险指数都维持在较低水平。

风险指数呈先增长后下降趋势:如DeepSeek、Qwen和MiniMax系列在网络攻击、生物风险和化学领域的表现。

风险指数呈快速增长趋势:如Grok系列在失控领域,Hunyuan系列在生物风险领域的表现。

查看更多

3. 推理模型带来能力分提升,但安全分未有相应提升

在能力-安全二维坐标下,推理模型的整体能力分显著高于非推理模型,模型分布更集中于右侧。 但在安全分上,推理模型与非推理模型的分布范围高度重叠,并未有明显的整体提升。

红色虚线代表的是风险帕累托前沿7。如图所示,处于风险帕累托前沿的模型以推理模型为主。

查看更多

4. 开源模型的能力和安全表现和闭源模型整体相当

如果只看能力分最高的模型,开源和闭源模型的能力差距在网络攻击等领域较为明显(如DeepSeek V3.1 Terminus Reasoning的62.4分 vs GPT-5 (high)的72.7分)。但若从大多数模型的表现来看,在网络攻击、化学风险和失控领域,开源模型与闭源模型在“能力-安全”分布上并无显著差异。例外的是生物风险领域,开源模型的能力明显弱于闭源模型。

注:尽管开源模型在整体能力与安全表现上与闭源模型相当,但这并不意味着二者实际风险水平相近。开源权重属性本身是影响风险的关键变量:它可能因降低恶意微调的门槛而增加风险;也可能因赋能防御者、改变攻防平衡而降低整体风险。

查看更多

5. 前沿模型的网络攻击能力增长迅速

在多个网络攻击能力基准上,前沿模型的能力增长迅速。

WMDP-Cyber测试了模型的网络攻击知识,前沿模型的最高分在一年间从68.9提升到88.0 。

CyberSecEval2-VulnerabilityExploit测试了模型识别代码漏洞的能力,前沿模型的最高分在一年间从55.4提升到91.7分。

CyBench测试了模型的CTF(Capture the Flag)能力,前沿模型的最佳得分在一年间从25.0提升到40.0 。

注:红色虚线连接的是得分创新高的模型。
查看更多

6. 前沿模型的生物能力已部分超越人类专家

在多个生物能力基准上,前沿模型的表现已经接近甚至超越人类专家。

BioLP-Bench测试了模型修复生物实验方案中的错误的能力,在这个基准上,已有 GPT-5.1 (high) 等8个模型超越了人类专家。

LAB-Bench-CloningScenarios测试了模型在克隆实验场景的能力,在这个基准上,已有 Gemini 3 Pro Proview 等4个模型超越了人类专家。

LAB-Bench-SeqQA测试了模型对DNA和蛋白质序列的理解能力,在这个基准上,已有 Gemini 3 Pro Proview 等2个模型超越了人类专家。
查看更多

7. …但多数前沿模型对有害生物问题的拒绝率偏低

SciKnowEval-BiologicalHarmfulQA和SOSBench-Bio这两个基准都由生物领域的有害问题构成。分数代表模型对有害问题的拒绝率,越高越好。蓝色虚线为线性回归趋势线。

在SciKnowEval-BiologicalHarmfulQA基准上,只有40%模型的拒绝率超过80%,同时还有35%的模型的拒绝率不足50%。

在SOSBench-Bio基准上也类似,只有15%的模型拒绝率超过80%,同时还有35%的模型拒绝率不足20% 。

查看更多

8. 前沿模型的化学能力和安全水平提升缓慢

WMDP-Chem测试了模型在化学武器相关代理知识的能力,可以看到过去一年前沿模型的得分有持续上升趋势,但增长较为缓慢,并且模型间的差距不大。

SOSBench-Chem包含了化学领域的有害问题,前沿模型在该基准上的拒绝率参差不齐,只有30%的模型的拒绝率超过80%,同时有25%的模型拒绝率不足40% 。从趋势线看,过去一年拒绝率的提升幅度较小。

查看更多

9. 多数前沿模型的越狱防护能力不足

StrongReject是一个越狱防护能力的评估基准,我们测试了其中的31种越狱方法。分数越高代表防护能力越强。

测试结果显示,只有40%的模型的得分超过80分,同时有20%的模型的得分不足60分 。稳定在80分以上的,只有Claude和GPT(从o1-mini起)系列。

查看更多

10. 大部分前沿模型的诚实性不足

MASK是一个模型诚实性的评估基准,分数越高代表模型越诚实。

测试结果显示,只有 Claude Sonnet 4.5 Reasoning、GPT-5.1 (high)、MiniMax M2 等6个模型得分超过80分,同时有30%模型得分不到50分。这种情况值得关注,因为模型的诚实性是其失控风险的早期预警指标———不诚实的模型可能会隐藏其自身实力或真实意图。

查看更多

名词解释

Concept


  1. 前沿模型: 发布时能力处在业界前沿水平的人工智能模型。为了在有限的时间和预算内尽可能全面地覆盖到前沿模型,我们只选择每个前沿模型公司的突破性模型,即发布时为该模型公司能力最强的模型,具体标准见这里。 

  2. 能力基准: 用于评估模型的能力的基准,特别是可能被恶意滥用(如协助黑客实施网络攻击)或导致失控的风险能力。 

  3. 安全基准: 用于评估模型安全性的基准。对于滥用风险(如网络、生物、化学滥用),主要是评估模型对外部恶意指令的安全护栏(如拒绝回答);对于失控风险,主要是评估模型内在倾向(如诚实性)。 

  4. 能力分CC :模型在各项能力基准测试中的加权平均分,分数越高,模型能力越强,被滥用(或自身失控)的风险就越高。分数区间为0-100。 

  5. 安全分SS :模型在各项安全基准测试中的加权平均分,分数越高,模型越能拒绝不安全的请求(滥用风险越低),或内在倾向越安全(失控风险越低)。分数区间为0-100。 

  6. 风险指数RR : 综合能力分和安全分,反映整体风险的一个分数。其计算公式为:R=C×(1β×S100)R = C \times \left(1 - \frac{\beta \times S}{100} \right)。分数区间为0-100。安全系数β\beta用于调节模型安全分对最终风险指数的贡献的系数,其反映了以下可能的情况:安全基准未能覆盖模型所有不安全行为;原本表现安全的模型可能被越狱或者恶意微调而变得不安全等。默认开源模型的安全系数为0.6,闭源模型为0.8。 

  7. 风险帕累托前沿: 在能力-安全二维图上,满足以下条件的模型的集合:不存在另一个模型,其能力分比该模型高且安全分比该模型低(能力分更高且安全分更低 => 理论上风险更高)。