Loading...
加载中...

Frontier AI Risk Monitoring Platform

This platform continuously monitors the risks posed by frontier models1 from leading AI companies worldwide across five domains: cyber offense, biological risks, chemical risks, harmful manipulation, and loss-of-control. By evaluating model performance on multiple capability benchmarks2 and safety benchmarks3, it reports a Capability Score4 and Safety Score5 for each model in each domain, then combines the two into a Risk Index6. The platform is intended to help policymakers, model developers, and third-party researchers understand frontier models' capabilities and risks, as well as how they are changing, and to provide early warning of emerging risks. The latest report covers 47 frontier models released by 13 AI companies from 2025Q3 to 2026Q2. The latest insights below are based on the evaluation results for these models. In this report, the Risk Index has been fully upgraded to v2.07, offering a fresh view of how frontier-model risks have changed over the past year.

Latest Insights 2026-07

1. Cyber, biological, and loss-of-control Risk Indices have risen severalfold in less than a year, with multiple models in each domain now exceeding the Capability Yellow Line8

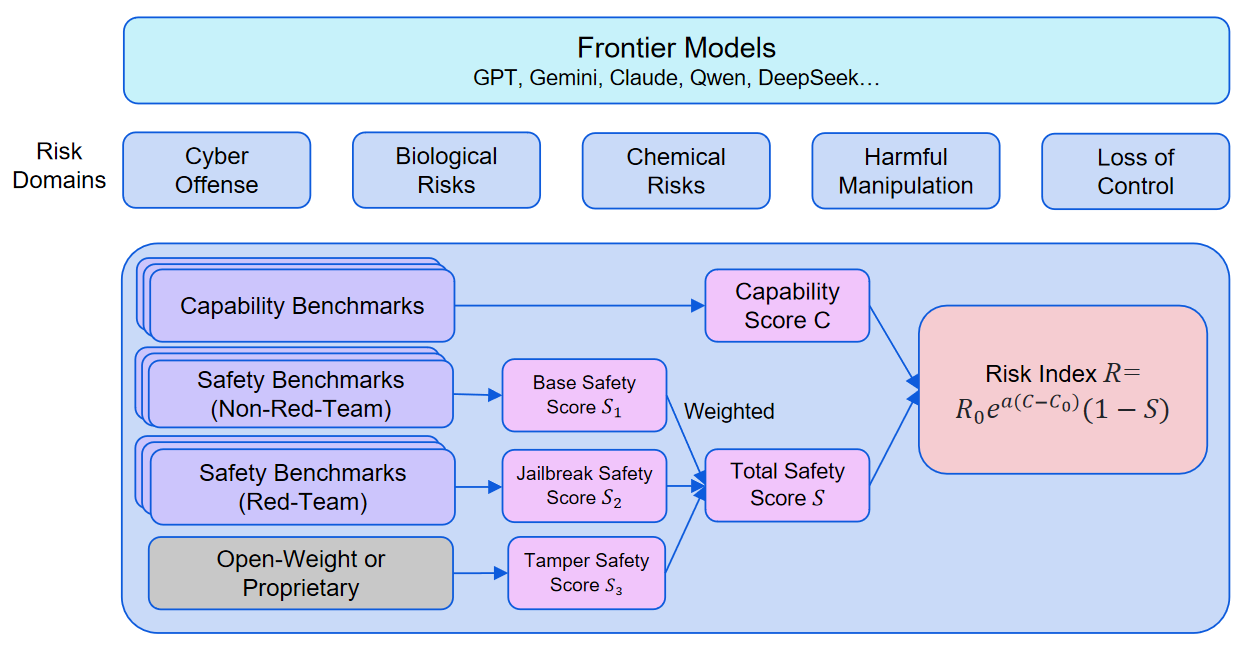
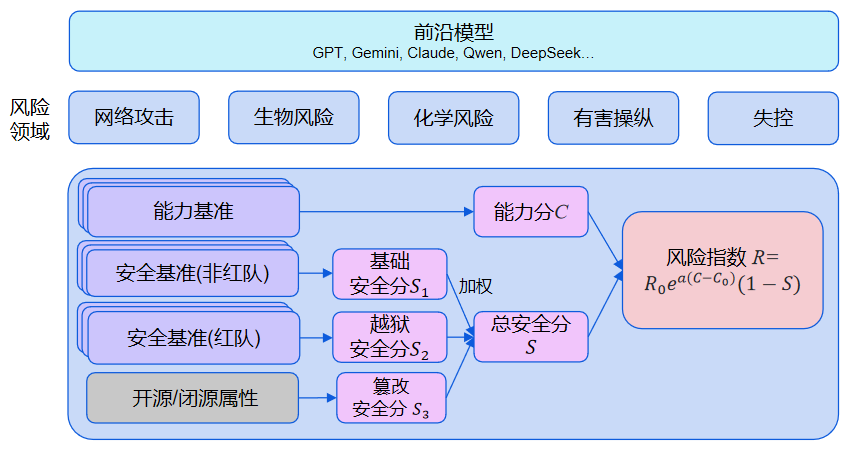
Under Risk Index v2.0, the average Risk Index of evaluated models in cyber offense, biological risks, and loss-of-control has risen rapidly in less than a year: 4.4x in cyber offense, 6.6x in biological risks, and 3.6x in loss-of-control.

Multiple models have already crossed the Capability Yellow Line8: 4 models in cyber offense, 22 in biological risks, and 12 in loss-of-control. Crossing the Capability Yellow Line means that, without safeguards, a model would significantly increase severe-harm risk relative to non-AI baselines.

Note: In the current v2.0 framework, Risk Indices have not yet been calculated for chemical risks or harmful manipulation, so this section focuses on cyber offense, biological risks, and loss-of-control.

View More

2. Model risk profiles are diverging: Gemini 3.1 Pro Preview has the highest biological and loss-of-control Risk Indices, while DeepSeek V4 Pro shows more pronounced cyber misuse risk

Gemini 3.1 Pro Preview has the highest overall Risk Indices in biological risks and loss-of-control, and both have crossed the Risk Yellow Line9. Unlike the Capability Yellow Line, crossing the Risk Yellow Line means that, even with existing safeguards, the model's residual risk still reaches the high-risk boundary.

DeepSeek V4 Pro has the highest Risk Index in cyber offense, and its loss-of-control Risk Index is second only to Gemini 3.1 Pro Preview.

The GPT family is rising quickly in cyber offense and loss-of-control, and has crossed the Risk Yellow Line in biological risks.

Kimi, MiniMax, Qwen, Doubao, and other families are also rising quickly in cyber offense and biological risks; in biological risks, they have already crossed the Risk Yellow Line. A total of 12 models have crossed the Risk Yellow Line in the biological domain.

Note: This evaluation does not include Claude's strongest models, Fable/Mythos 5.

View More

3. Proprietary models continue to dominate the capability frontier across multiple domains, while open-weight models are generally weaker on safeguards for cyber, biological, chemical, and manipulation risks

Proprietary models still dominate the capability frontier across domains, with GPT-5.5, Claude Opus 4.8, Gemini 3.1 Pro Preview, and other proprietary models maintaining a capability lead in multiple domains.

Across the four misuse-risk domains of cyber offense, biological risks, chemical risks, and harmful manipulation, open-weight models have substantially lower Safety Scores than proprietary models.

In loss-of-control, Safety Score distributions are similar for open-weight and proprietary models, but some proprietary models, such as Gemini 3.1 Pro Preview and Grok 4, have notably lower Safety Scores. These models pose higher risk because they combine high Capability Scores with low Safety Scores.

View More

4. Leading models' long-horizon vulnerability exploitation and penetration capabilities are improving quickly, while safeguards such as prompt-injection defenses are regressing

In less than a year, the top model score rose by 68% on CyBench and 35% on CVE-Bench, indicating rapid progress by frontier models on autonomous, long-horizon vulnerability exploitation and penetration tasks.

At the same time, cyber safeguards have not improved in step. The average Safety Score fell by 3% in the latest quarter, and latest-quarter models' average performance on prompt-injection defense regressed.

View More

5. More than ten models now exceed human-expert levels in wet-lab troubleshooting and sequence understanding, but basic safeguards such as biological refusal have not improved in step

On capabilities, 22 models now exceed human-expert levels in wet-lab troubleshooting (BioLP-Bench), and 11 models exceed human-expert levels in sequence understanding (SeqQA). Frontier models' biological reasoning (FrontierScience-Bio) and bioinformatics capabilities (BixBench) continue to improve.

On safety, the average Safety Score is broadly unchanged from the previous quarter, and basic biological refusal (BiologicalHarmfulQA) showed no clear improvement in the latest quarter.

View More

6. The latest-quarter models did not set a new high in loss-of-control risk, but weak honesty and covert influence over users still reveal safety gaps

Compared with the rapid growth seen last quarter, models released in the latest quarter did not set a new high in the loss-of-control Risk Index, and none reached the Risk Yellow Line.

On capabilities, self-replication (Self-Proliferation), self-improvement (MLE-Bench), situational awareness (SAD-mini), and related capabilities did not set new highs.

On safety, loss-of-control safeguards still show no clear improvement: model honesty (MASK) remains weak overall, and some models still show a pronounced tendency to covertly influence users (DarkBench).

View More

7. Under advanced jailbreak attacks, average safety falls sharply in cyber offense, biological risks, chemical risks, and harmful manipulation, with open-weight models showing weaker jailbreak resistance

After jailbreak red-teaming attacks are added, frontier models' average safety scores fall from 78.2 to 8.9 in biological risks, from 90.5 to 29.2 in cyber offense, from 83.7 to 53.1 in chemical risks, and from 87.8 to 36.4 in harmful manipulation.

Jailbreak resistance varies greatly across models. Proprietary models such as GPT and Claude show stronger jailbreak resistance, while open-weight models are generally weaker.

View More

Explanation of Terms

Concept


  1. Frontier Models: AI models that were at the industry frontier when released. To cover as many frontier models as possible within limited time and budget, we select only the breakthrough model from each frontier AI company, meaning the company's most capable model at the time of release. The specific criteria can be found here

  2. Capability Benchmarks: Benchmarks used to evaluate model capabilities, especially risky capabilities that could be maliciously misused or contribute to loss-of-control. 

  3. Safety Benchmarks: Benchmarks used to evaluate model safety. For misuse risks, they mainly measure how well a model resists malicious external instructions. For loss-of-control risks, they focus more on the model's internal propensities, honesty, and ability to suppress inappropriate behavior. Safety benchmarks are further divided into red-team and non-red-team benchmarks: red-team benchmarks use jailbreak methods to attack the model, while non-red-team benchmarks send harmful instructions directly to the model. 

  4. Capability Score CC: The weighted average of a model's scores across capability benchmarks. The higher the score, the stronger the model's risky capabilities for misuse or loss-of-control. 

  5. Total Safety Score SS: A composite score for model safety. Higher scores indicate safer models. For cyber offense, biological risks, and other misuse risks, the Total Safety Score combines the Base Safety Score, Jailbreak Safety Score, and Tamper Safety Score by weighted average. The three safety scores are explained in detail here. For loss-of-control risk, the Total Safety Score still comes directly from the average result of loss-of-control safety benchmarks. 

  6. Risk Index RR: A risk score that combines capability and safety. The formula for Risk Index v2.0 is R=R0ea(CC0)×(1S)R = R_0 e^{a (C - C_0)} \times (1 - S), where CC is the Capability Score, SS is the Safety Score, R0R_0 is the Risk Yellow Line threshold, C0C_0 is the Capability Yellow Line threshold, and aa is the capability-risk coefficient. The formula is explained in detail here

  7. Risk Index v2.0: The new risk framework adopted by the platform starting in 2026Q2. Compared with v1.5, v2.0 places greater emphasis on real-world tasks and advanced attack scenarios, adds CVE-Bench, BixBench, the FrontierScience series, and FRT red-teaming benchmarks, and changes the Risk Index formula from a linear capability model to an exponential capability model. In the current v2.0 framework, Risk Indices are provided for cyber offense, biological risks, and loss-of-control. Chemical risks and harmful manipulation do not yet have Capability Yellow Lines, so the platform mainly provides capability and safety evaluation results for those domains. Details on the newly added benchmarks can be found here

  8. Capability Yellow Line Threshold C0C_0: A reference line indicating that, without safeguards, model capability significantly increases severe-harm risk relative to non-AI baselines. Crossing the Capability Yellow Line means that, without safeguards, a model's capabilities are approaching the risk level corresponding to OpenAI High Risk or Anthropic ASL-3, significantly amplifying cyber offense, biological/chemical misuse, or loss-of-control threats relative to non-AI baselines. However, it measures capability only, and does not mean that the model has already reached high risk in deployment. Capability Yellow Lines are currently defined for cyber offense, biological risks, and loss-of-control. 

  9. Risk Yellow Line Threshold R0R_0: A reference line indicating that the model's residual risk in actual deployment has reached the high-risk boundary, normalized to 100. Crossing the Risk Yellow Line means that, in a real deployment environment and after accounting for actual safeguards, the model's residual risk still reaches a high-risk level, significantly amplifying cyber offense, biological/chemical misuse, or loss-of-control threats relative to non-AI baselines. If a model crosses the Risk Yellow Line, stronger safeguards are recommended to reduce deployment risk. 

前沿AI风险监测平台

本平台持续监测全球领先AI公司的前沿模型1在五个领域的风险状态:网络攻击、生物风险、化学风险、有害操纵和失控领域,通过测试模型在多个能力基准2和安全基准3上的表现,给出每个模型在每个领域的能力分4和安全分5,并综合这两方面的得分计算各模型的风险指数6。平台旨在为政策制定者、模型开发者和第三方研究者了解前沿模型的能力和风险水平及其变化趋势提供参考,并对潜在新兴风险提出预警。最新一期报告覆盖了13家AI公司在2025Q3到2026Q2发布的47个前沿模型,以下最新洞察基于这些模型的测试结果得出。在本期报告中,风险指数全面升级2.0版7,重新审视了过去一年前沿模型的风险变化趋势。

最新洞察 2026-07

1. 网络、生物、失控风险指数不到一年增长数倍,各领域均有多个模型突破能力黄线8

基于风险指数2.0版,网络攻击、生物风险和失控领域的被测模型平均风险指数在不到一年内快速上升:网络攻击增长4.4倍,生物风险增长6.6倍,失控风险增长3.6倍。

已有多个模型突破能力黄线8:网络攻击有4个模型超过能力黄线,生物风险有22个,失控领域有12个。突破能力黄线意味着若不加安全防护,模型相比非AI基线将显著增加严重危害的风险。

注:当前2.0版中,化学风险和有害操纵领域尚未计算风险指数,因此这里主要展示网络攻击、生物风险和失控领域。

查看更多

2. 模型风险重心分化:Gemini 3.1 Pro Preview生物风险与失控风险指数最高,DeepSeek V4 Pro网络攻击滥用风险更突出

Gemini 3.1 Pro Preview在生物风险和失控领域的风险指数全局最高,且均已超过风险黄线9。不同于能力黄线,突破风险黄线意味着模型在已有的安全防护水平下,其剩余风险仍达到高风险边界。

DeepSeek V4 Pro在网络攻击领域风险指数最高,失控领域风险指数仅次于Gemini 3.1 Pro Preview。

GPT系列在网络攻击和失控领域增长较快,并已在生物风险领域越过风险黄线。

Kimi、MiniMax、Qwen、Doubao等系列在网络攻击和生物风险领域也增长较快,其中生物风险领域已越过风险黄线。生物风险领域已有12个模型越过风险黄线。

注:本次测评未包含Claude最强模型Fable/Mythos 5。

查看更多

3. 闭源模型继续主导多领域能力上限,开源模型在网络、生物、化学和有害操纵防护上整体更弱

闭源模型仍主导各领域能力上限,GPT-5.5、Claude Opus 4.8、Gemini 3.1 Pro Preview等闭源模型在多个领域保持能力领先。

在网络攻击、生物风险、化学风险、有害操纵四个滥用风险领域,开源模型的安全分明显低于闭源模型。

在失控领域,开源和闭源模型的安全分分布接近,部分闭源模型(如Gemini 3.1 Pro Preview、Grok 4)安全分显著更低,这些模型因能力分高且安全分低而形成更高风险。

查看更多

4. 领先模型的长程漏洞利用和网络渗透能力快速提升,但提示词注入等安全防护反而退步

不到一年的时间内,前沿模型在CyBench的最高分数增长68%,在CVE-Bench增长35%,说明这些模型在自主、长程的漏洞利用和网络渗透任务中进步很快。

同时,网络攻击安全防护并未同步改善,平均安全分在最近一个季度下降3%。在提示词注入防御方面,最新季度模型的平均表现出现了退步。

查看更多

5. 湿实验排查与序列理解已有超十款模型超过人类专家水平,但生物拒答等基础安全防护未同步进步

能力方面,湿实验问题排查(BioLP-Bench)能力已有22个模型超过人类专家水平,序列理解(SeqQA)能力已有11个模型超过人类专家水平。前沿模型的生物推理能力(FrontierScience-Bio)、生物信息处理能力(BixBench)持续增强。

安全方面,模型平均安全分与上季度基本持平,基础生物拒答(BiologicalHarmfulQA)在最新季度进步不明显。

查看更多

6. 最新季度失控风险未创新高,但诚实性不足和暗中影响用户倾向仍暴露安全短板

相比于上季度的快速增长,最新季度发布的模型的失控风险指数未出现新高,也均未达到风险黄线。

从能力看,自我复制(Self-Proliferation)、自我改进(MLE-Bench)、情境感知(SAD-mini)等能力均未出现新高。

从安全看,失控安全表现仍未有明显改善:模型诚实性(MASK)整体不高,部分模型仍存在较明显的暗中影响用户倾向(DarkBench)。

查看更多

7. 高级越狱攻击下网络攻击、生物风险、化学风险、有害操纵平均安全表现大幅下降,开源模型抗越狱能力更薄弱

加入越狱红队攻击后,前沿模型的生物安全平均分从78.2降至8.9,网络攻击从90.5降至29.2,化学风险从83.7降至53.1,有害操纵从87.8降至36.4。

不同模型抗越狱能力差异很大。GPT、Claude等闭源模型的抗越狱能力较强,开源模型的抗越狱能力普遍较弱。

查看更多

名词解释

Concept


  1. 前沿模型:发布时能力处在业界前沿水平的人工智能模型。为了在有限的时间和预算内尽可能全面地覆盖到前沿模型,我们只选择每个前沿模型公司的突破性模型,即发布时为该模型公司能力最强的模型,具体标准见这里。 

  2. 能力基准:用于评估模型能力的基准,特别是那些可能被恶意滥用或推动失控的风险能力。 

  3. 安全基准:用于评估模型安全性的基准。对于滥用风险,主要衡量模型对外部恶意指令的防御能力;对于失控风险,则更多衡量模型内在倾向、诚实性与不当行为抑制能力。安全基准又分为红队和非红队两种,红队基准使用越狱方法对模型进行攻击,非红队基准则直接向模型发送有害指令。 

  4. 能力分CC:模型在各项能力基准中的加权平均分。分数越高,模型可能被滥用或推动失控的风险能力越强。 

  5. 总安全分SS:模型安全性的综合分数,分数越高表示模型越安全。对于网络攻击、生物风险等滥用风险,总安全分由基础安全分、越狱安全分和篡改安全分加权合成,三种安全分的具体说明详见这里;对于失控风险,总安全分仍直接来自失控安全基准的平均结果。 

  6. 风险指数RR:综合能力与安全后的风险分数。风险指数2.0版的计算公式为R=R0ea(CC0)×(1S)R = R_0 e^{a (C - C_0)} \times (1 - S),其中CC为能力分,SS为安全分,R0R_0为风险黄线阈值,C0C_0为能力黄线阈值,aa为能力-风险系数。计算公式的具体说明详见这里。 

  7. 风险指数2.0版:平台在2026Q2开始采用的新版本风险框架。相比1.5版,2.0版进一步强调真实任务与高级攻击场景,新增CVE-Bench、BixBench、FrontierScience系列与FRT红队攻击基准,并将风险指数公式从线性能力模型改为指数能力模型。当前2.0版中,网络攻击、生物风险和失控领域提供风险指数;化学风险和有害操纵领域尚未设置能力黄线,因此主要提供能力与安全测评结果。新增基准的说明详见这里。 

  8. 能力黄线阈值 C0C_0:模型能力在无防护条件下相比非AI基线显著增加严重危害风险的参考线。突破能力黄线表示模型能力在无防护条件下已经接近OpenAI High RiskAnthropic ASL-3所对应的风险水平,相比非AI基线显著放大网络攻击、生物化学滥用或失控威胁;但它只衡量能力,不代表模型在实际部署中已经达到高风险。当前网络攻击、生物风险和失控领域设置了能力黄线。 

  9. 风险黄线阈值 R0R_0:模型在实际部署环境中的剩余风险已经达到高风险边界的参考线,统一归一化为100。突破风险黄线表示模型在实际部署环境中、结合实际安全防护措施后,其剩余风险仍然达到高风险水平,即相比非AI基线显著放大网络攻击、生物化学滥用或失控威胁。若模型突破风险黄线,建议加强安全防护措施,降低实际部署风险。