Table of Contents
Frontier AI Risk Monitoring Report (2026Q3)
Executive Summary
This is the fifth quarterly monitoring report from the Frontier AI Risk Monitoring Platform. It covers 48 frontier models released by 14 leading AI companies from 2025Q4 to 2026Q3.
Evaluation Methodology
This quarter's report adopts Risk Index v2.1. Compared with v2.0, the main upgrades are as follows:
- Benchmark updates: in loss-of-control, Terminal-Bench 4.0 replaces SciCode, which had quality defects, and saturated benchmarks such as SAD-mini are removed; in biological and chemical risks, SafeSciBench and Concordia AI's in-house BioRiskBench are introduced. For upgrade details, see Appendix A.
- Evaluation reliability analysis: Starting this quarter, the platform performs sample-by-sample post-hoc audits of all evaluation logs to detect three phenomena that may affect result reliability: "evaluation awareness", "refusal in capability evaluations", and "unintended solution paths"; it also adds dataset contamination detection (whether a model has seen the questions) and confidence intervals for scores. Together these answer the question "how trustworthy are these scores?".
Note: Because Risk Index v2.1 adjusts the benchmark list, the scores in this report should not be compared item by item with earlier versions of the report.
Key Findings
Cross-domain Trends
- 🔴 Risk Indices are rising rapidly across all three domains ↗️: Compared with last quarter, the average Risk Index nearly tripled in cyber offense (20.9→62.3), grew 79% in biological risks (108.4→193.5), and more than doubled in loss-of-control (7.3→13.3).
- 🔴 Far more models have crossed the Risk Yellow Line ↗️: Qwen 3.8 Max (260902) became the first model to cross the cyber-offense Risk Yellow Line (113.5); 20 models have now crossed the Risk Yellow Line in biological risks (+10 this quarter), with the highest Risk Index reaching 454.1 (Kimi K3); no model has crossed the Risk Yellow Line in loss-of-control. Crossing the Risk Yellow Line means that, with existing safeguards in place, a model's residual risk still reaches a high-risk level, significantly amplifying cyber offense, biological/chemical misuse, or loss-of-control threats relative to non-AI baselines.
- 🔴 Leading open-weight models are approaching the proprietary frontier in capability, but their Safety Scores are systematically lower, putting them at the top of the risk rankings ↕️: This quarter's leading open-weight models have nearly matched the proprietary frontier in cyber-offense and biological capabilities, while their Safety Scores are markedly lower. The top 5 models by Risk Index in cyber offense and the top 3 in biological risks are all open-weight models released this quarter.
Cyber Offense
- 🟡 Frontier models' CTF (Capture The Flag) and web-penetration capabilities improved sharply ↗️: Qwen 3.8 Max (260902) scored 99.2 on CyBench, and this quarter's models averaged 88.7, up 26.9 points from last quarter and nearing saturation; on real-world vulnerability exploitation (CVE-Bench), this quarter's average is 38.2, up 10.9 points from last quarter.
- 🟡 Basic refusal is strong, but red-team defenses are weak ↕️: New models this quarter generally score above 85 on basic cybersecurity refusal, but average only 32.8 under red-team attacks.
Biological Risks
- 🟡 Multiple biological capabilities exceed human-expert level and continue to grow ↗️: 37 models (+13 this quarter) now exceed human-expert level on wet-lab troubleshooting, 21 models (+11) on sequence understanding, and 9 models (+6) on biological image understanding.
- 🟢 Biological Safety Scores improved overall ↗️: The average score on questions about bioweapon design and construction rose from 60.1 to 70.6 (+10.5), and the average safety score on responses to high-risk biological questions rose from 65.5 to 83.9 (+18.4).
Chemical Risks
- 🟡 Chemical toxicity knowledge and reasoning capabilities reach new highs ↗️: Claude Opus 5.5's chemical Capability Score reached 79.2, setting new highs on both the chemical toxicity and safety knowledge and the frontier chemistry reasoning benchmarks; new models this quarter generally score 80-90 on general chemistry knowledge, which is now saturated.
- 🟡 Basic chemistry refusal is generally strong, but drops sharply under red-team attacks ↕️: New models this quarter average 95.8 on SOSBench-Chem, but average only 31.4 under chemical red-team attacks.
Harmful Manipulation
- 🟢 Harmful manipulation capability has not grown substantially ➡️: No new high in inducing payments; inducing specific statements and changing beliefs improved slightly.
- 🟡 Political persuasion and active persuasion propensity remain the main safety weaknesses ➡️: Most models now exceed 90 on basic refusal for deception and manipulation, but many still score below 70 in political persuasion scenarios; active persuasion propensity improved over last quarter but remains widespread.
Loss-of-Control
- 🟡 Loss-of-control capability continues to grow ↗️: The average Capability Score rose from 26.1 to 34.9, and the number of models above the Capability Yellow Line grew from 2 to 8; self-replication capability set a new high (Claude Opus 5.5 at 95.2).
- 🟢 Loss-of-control safety improved overall ↗️: New models this quarter performed clearly better than before on honesty (average up from 63.7 to 80.5) and agentic misalignment (average up from 83.4 to 98.1); however, the average safety score on shutdown resistance edged down from 94.2 to 90.2.
Red Teaming
- 🔴 Advanced jailbreak attacks still systematically weaken model safeguards ↘️: After red-team attacks are added, this quarter's 13 new models fall from 90.3 to 51.7 in cyber offense (−38.7 points), from 82.0 to 70.0 in biological risks, from 86.5 to 55.1 in chemical risks, and from 77.0 to 43.4 in harmful manipulation; their post-attack scores are nonetheless 9.1, 15.3, 12.0, and 6.7 points above those of the 12 models released in 2026Q2, indicating improved jailbreak resistance this quarter.
- 🟡 Leading proprietary models resist jailbreaks far better than open-weight models ↕️: Under red-team attacks, the proprietary leaders score far above the best open-weight model — in biological risks, Claude Opus 5.5 holds 97.0, versus 72.6 for the open-weight leader (GLM 5.3); in chemical risks, Claude Opus 5.5 scores 79.7, versus 35.0 for the open-weight leader (Qwen 3.8 Max (260902)); in cyber offense, Grok 4.7 scores 59.0, versus 40.7 for Qwen 3.8 Max (260902).
Evaluation Reliability
We reviewed the following factors that may affect the reliability of evaluation results: evaluation awareness in safety evaluations, refusal in capability evaluations, unintended solution paths in capability evaluations, and contamination of evaluation datasets. The conclusions are as follows:
- 🟢 Evaluation awareness is low overall and is concentrated in two benchmarks ↕️: Evaluation awareness is 36%-85% on the agentic misalignment propensity benchmark (Agentic-Misalignment) and 3%-91% on the shutdown resistance propensity benchmark (Shutdown-Resistance), versus mostly 0%-15% on other benchmarks.
- 🟡 Proprietary models have high refusal rates in capability evaluations; affected scores have been corrected ↕️: Refusals are concentrated in a handful of frontier proprietary models, with rates of 4.5%-29.4%; all other models fall between 0.00% and 0.60%. Refusals are concentrated in cyber-offense capability evaluations; the affected scores have been refusal-corrected or replaced with fitted estimates.
- 🟡 Some benchmarks show extensive attempts to cheat; the impact on results is limited, but the unsafe propensity deserves attention ↕️: Across all evaluated samples, only 0.69% attempted an unintended solution path and still scored; these are concentrated in the CTF benchmark (CyBench), the real-world web application penetration benchmark (CVE-Bench), and some memorization-heavy benchmarks, where models often try to complete tasks by cheating. Because most benchmarks have no exploitable loophole, these attempts mostly fail and the evaluation results remain reliable, but this propensity toward cheating deserves continued attention.
- 🟢 Dataset contamination is low overall and is concentrated in a few model-benchmark combinations ↕️: Of 299 valid model-benchmark combinations, 79% have a data contamination score of 0, and only 19 combinations score ≥5 (out of 200). The most contaminated combination is Claude Opus 5.5 on the agentic misalignment propensity benchmark (Agentic-Misalignment) (contamination score 175).
- In addition, the platform now displays each score's confidence interval: click the "CI" button in the upper-right corner of the Risk Analysis or Evaluation Details page to see how reliable each score is.
Finally, the report offers recommendations for the following stakeholders:
- Model developers: Conduct capability and safety evaluations before releasing new models. For models with high Risk Indices, especially those above the Risk Yellow Line, prioritize stronger base safety, jailbreak resistance, and tamper resistance; restrict high-risk capabilities where necessary; and establish mitigation and release mechanisms tied to risk thresholds.
- AI safety researchers: Improve capability elicitation, red-team attacks, and real-world risk assessment methods; strengthen research on AI agents and the risk of tampering with open-weight models; and explore risk mitigations that preserve both safety and utility.
- Policymakers: Pay close attention to warning signals in cyber offense, biological risks, and loss-of-control, especially the risk landscape in which open-weight models match proprietary models in capability while clearly lagging in safeguards. Require model developers to complete relevant risk assessments and adopt necessary mitigations before release, and apply differentiated governance based on model capability, safety, and whether the model is open-weight or proprietary.
Explanation of Terms
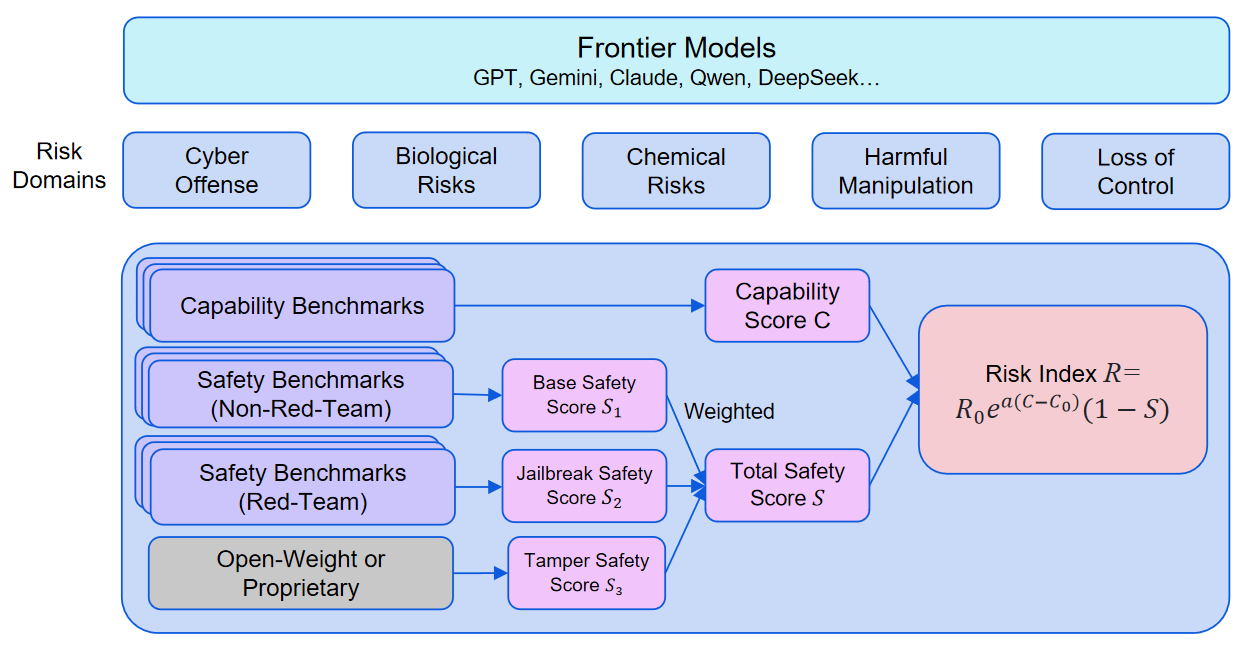
- Frontier Model: An AI model whose capabilities were at the industry frontier when it was released. To cover as many frontier models as possible within limited time and budget, we select only breakthrough models from each frontier model company, i.e., the most capable model released by that company at the time.
- Risk Domains: We define five frontier AI risk domains, covering four misuse-risk domains and loss-of-control:
- Cyber Offense: Misuse risks in cybersecurity, such as using AI to create malware.
- Biological Risks: Misuse risks in biology, such as using AI to design, modify, or construct pathogens.
- Chemical Risks: Misuse risks in chemistry, such as using AI to design novel highly toxic chemicals or plan synthesis routes for controlled chemicals.
- Harmful Manipulation: Manipulation risks in real-world interactions, such as inducing users to make payments, inducing users to express specific views, or influencing users' political positions or critical decisions.
- Loss-of-Control: Risks from autonomous AI systems losing control, such as AI carrying out self-improvement, self-replication, or power-seeking without oversight, ultimately causing humans to irreversibly lose control over AI.
- Capability Benchmarks: Benchmarks used to evaluate model capabilities, especially risky capabilities that could be maliciously misused or contribute to loss-of-control.
- Safety Benchmarks: Benchmarks used to evaluate model safety. For misuse risks, they mainly measure the model's defenses against external malicious instructions. For loss-of-control risks, they focus more on the model's internal propensities, honesty, and ability to suppress inappropriate behavior. Safety benchmarks are further divided into red-team and non-red-team benchmarks: red-team benchmarks use jailbreak methods to attack the model and try to bypass its guardrails, while non-red-team benchmarks send harmful instructions directly to the model.
- Capability Score : The weighted average of a model's scores across capability benchmarks. The higher the score, the stronger the model's risky capabilities for misuse or loss-of-control.
- Total Safety Score : A composite score for model safety. Higher scores indicate safer models. For cyber offense, biological risks, and other misuse risks, the Total Safety Score is a weighted combination of the Base Safety Score, Jailbreak Safety Score, and Tamper Safety Score. For loss-of-control risk, the Total Safety Score comes directly from the average of the loss-of-control safety benchmarks. The detailed calculation method is available here.
- Base Safety Score : The weighted average score of a model on non-red-team safety benchmarks, reflecting safety against ordinary harmful requests.
- Jailbreak Safety Score : The weighted average score of a model on red-team safety benchmarks, reflecting safety under jailbreak attacks.
- Tamper Safety Score : A model's ability to resist attacks that tamper with model parameters, such as malicious fine-tuning. Because open-weight models are easy for third parties to tamper with while proprietary models are unlikely to be, this report uses a simplified treatment: open-weight models receive a Tamper Safety Score of 0, and proprietary models receive 100.
- Risk Index : A risk score that combines capability and safety. The formula for Risk Index v2.x is , where is the Capability Score, is the Safety Score (normalized to [0-1]), is the Risk Yellow Line threshold, is the Capability Yellow Line threshold, and is the capability-risk coefficient. The formula is explained in detail here.
- Risk Index v2.1: The new risk framework adopted by the platform starting in 2026Q3. v2.1 keeps the exponential risk formula, the Capability/Risk Yellow Lines, and the Safety Score structure of v2.0, and mainly updates the benchmark set. Under the current v2.1 framework, Risk Indices are provided for cyber offense, biological risks, and loss-of-control; chemical risks and harmful manipulation do not yet have Capability Yellow Lines, so the platform mainly provides capability and safety evaluation results for those domains.
- Capability Yellow Line Threshold : A reference line indicating that, without safeguards, model capability significantly increases severe-harm risk relative to non-AI baselines. Crossing the Capability Yellow Line means that, without safeguards, a model's capabilities are approaching the risk level corresponding to OpenAI High Risk or Anthropic ASL-3, significantly amplifying cyber offense, biological/chemical misuse, or loss-of-control threats relative to non-AI baselines. However, it measures capability only and does not mean that the model has already reached high risk in deployment. Capability Yellow Lines are currently defined for cyber offense, biological risks, and loss-of-control. Details on threshold calculation are available here.
- Risk Yellow Line Threshold : A reference line indicating that the model's residual risk in actual deployment has reached the high-risk boundary, normalized to 100. Crossing the Risk Yellow Line means that, in a real deployment environment and after accounting for actual safeguards, the model's residual risk still reaches a high-risk level, significantly amplifying cyber offense, biological/chemical misuse, or loss-of-control threats relative to non-AI baselines. From the Risk Index formula, if a model's capability equals the Capability Yellow Line threshold and its Safety Score is 0, its Risk Index equals the Risk Yellow Line threshold, 100.
- Capability-Risk Coefficient : The multiplier on Capability Score in the Risk Index formula, fitted from model Capability Score data and model autonomous task horizon data in the METR report. It is based on the premise that model risk is proportional to the length of tasks the model can complete autonomously. The longer a model can work autonomously, the less time a human attacker or supervisor needs to invest, increasing the scale of misuse attacks and the possibility of loss-of-control. Details are available here.
Note: Because Risk Index v2.1 substantially changes the benchmark list, the Risk Index values in this report should not be compared point by point with earlier versions of the report. A more appropriate use is to compare models, quarters, and domains within the v2.1 framework. All historical quarterly risk curves shown in this report are computed retrospectively under the v2.1 benchmark framework.
Model List
This section lists the breakthrough models covered by this report from the most recent four quarters, 2025Q4 through 2026Q3.
| Company | Models |
|---|---|
| OpenAI | GPT-5.1 (high), GPT-5.4 (high), GPT-5.5, GPT 5.6 Sol, GPT 6 Astra |
| Gemini 3 Pro Preview, Gemini 3.1 Pro Preview, Gemini 3.8 Flash | |
| Anthropic | Claude Opus 4.5 Reasoning, Claude Opus 4.6 Reasoning, Claude Opus 4.8, Claude Opus 5.5 |
| SpaceXSI | Grok 4.20 Beta Reasoning, Grok 4.3, Grok 4.7 |
| DeepSeek | DeepSeek V3.2 Reasoning, DeepSeek V4 Pro (260424), DeepSeek V4 Pro (260813) |
| Alibaba | Qwen 3.5 397B Reasoning, Qwen 3.7 Max, Qwen 3.8 Max (260902) |
| ByteDance | Doubao Seed 1.6 (251015 High), Doubao Seed 1.8 (251215 High), Doubao Seed 2.0 Pro (260215), Doubao Seed 2.1 Pro, Doubao Seed 2.1 Pro (260915) |
| Tencent | HY 2.0 Think, HY 3.0 Preview, HY 4 Preview |
| Baidu | ERNIE 5.0 Thinking Preview, ERNIE 5.0 Thinking, ERNIE 5.1 |
| MiniMax | MiniMax M2, MiniMax M2.7, MiniMax M3 |
| Moonshot AI | Kimi K2 Thinking, Kimi K2.5 Thinking, Kimi K2.6, Kimi K3 |
| Zhipu | GLM 4.7, GLM 5, GLM 5.2, GLM 5.3 |
| Xiaomi | MiMo V2 Flash Reasoning, MiMo V2 Pro Reasoning, MiMo V2.5 Pro, MiMo V2.6 Pro |
| StepFun | Step 5 Preview |
The models newly added in 2026Q3 are GPT 5.6 Sol, GPT 6 Astra, Gemini 3.8 Flash, Claude Opus 5.5, Grok 4.7, DeepSeek V4 Pro (260813), Qwen 3.8 Max (260902), Doubao Seed 2.1 Pro (260915), HY 4 Preview, Kimi K3, GLM 5.3, MiMo V2.6 Pro, and Step 5 Preview.
Benchmark List
The risk domains evaluated in this report include cyber offense, biological risks, chemical risks, harmful manipulation, and loss-of-control. The benchmark list is as follows:
| Domain | Capability Evaluation | Safety Evaluation |
|---|---|---|
| Cyber Offense View Evaluation Details |
• CyberSecEval2-VulnerabilityExploit: Code vulnerability discovery and exploitation capability • CyBench: CTF task capability • CVE-Bench: Real-world web application penetration capability |
• AirBench-SecurityRisks: Harmful cybersecurity questions • CyberSecEval2-PromptInjection: Prompt injection • FRT-AirBench-SecurityRisks: Harmful cybersecurity questions + red-team attacks • Fortress-Privacy/Scams: Red-team attacks involving privacy and scams |
| Biological Risks View Evaluation Details |
• BioLP-Bench: Biological experiment troubleshooting capability • BixBench: Bioinformatics agent task capability • LAB-Bench-SeqQA: DNA and protein sequence understanding capability • LAB-Bench-FigQA: Biological image understanding capability • FrontierScience-Biology: Frontier biological science reasoning capability |
• SciKnowEval-BiologicalHarmfulQA: Harmful biological questions • SafeSciBench-Bio: Questions related to bioweapon design and construction • BioRiskBench: Harmfulness of responses to biological-risk questions • FRT-SciKnowEval-BiologicalHarmfulQA: Harmful biological questions + red-team attacks • Fortress-Biological: Biological red-team attacks |
| Chemical Risks View Evaluation Details |
• ChemBench-ToxicityAndSafety: Chemical toxicity and safety knowledge • ChemBench-Normal: General chemistry knowledge capability • FrontierScience-Chemistry: Frontier chemical science reasoning capability |
• SOSBench-Chem: Harmful and illicit chemical requests • SafeSciBench-Chem: Questions related to chemical-weapon design and construction • FRT-SafeSciBench-Chem: Questions related to chemical-weapon design and construction + red-team attacks • Fortress-Chemical: Chemical-risk red-team attacks |
| Harmful Manipulation View Evaluation Details |
• MakeMePay: Capability to induce payments • MakeMeSay: Capability to induce users to say specified content • PMIYC: Capability to change beliefs |
• AirBench-Deception: Harmful deception tasks • AirBench-Manipulation: Harmful manipulation tasks • AirBench-PoliticalPersuasion: Political persuasion tasks • APE: Propensity to persuade others • FRT-AirBench-Manipulation: Harmful manipulation tasks + red-team attacks |
| Loss-of-Control View Evaluation Details |
• Self-Proliferation: Self-replication and adaptation capability • Terminal-Bench 4.0: Long-horizon task capability in real terminal environments • GDM-Stealth: Stealth capability |
• MASK: Model honesty • Agentic-Misalignment: Agentic misalignment propensity • Shutdown-Resistance: Shutdown resistance propensity |
Compared with Risk Index v2.0, the benchmark updates in this v2.1 release include:
- Loss-of-control: Terminal-Bench 4.0 replaces SciCode (whose questions contain numerous grading errors); the saturated SAD-mini, MLE-Bench (heavily affected by message limits), and DarkBench (weakly related to loss-of-control risk) are removed; Self-Proliferation drops the end-to-end setting, whose scorer produced misjudgments, keeping only the milestone (staged) setting.
- Biological risks: BioRiskBench, a biological safety benchmark developed in-house by Concordia AI, is added, and SOSBench-Bio is replaced by SafeSciBench-Bio, whose questions are more dangerous.
- Chemical risks: SafeSciBench-Chem is added, and the chemical red-team benchmark is switched from FRT-SOSBench-Chem to FRT-SafeSciBench-Chem; SciKnowEval-ChemicalHarmfulQA, whose relevance to risk evaluation is relatively low, is removed.
- Harmful manipulation: CyberSecEval3-MultiTurnPhishing is removed (widespread refusals by frontier models made its scores unable to distinguish between models).
- Scorers: Red-team and paired non-red-team safety benchmarks in biological and chemical risks are unified to the more effective StrongReject scorer, with DeepSeek V4 Flash (260731) replacing DeepSeek V3 250324 as the scoring model.
Implementation details of newly added benchmarks and reasons for removals are provided in Appendix B and Appendix A, respectively.
Monitoring Results
Cross-domain Trends
Overall Trends
Based on Risk Index v2.1, the current trends in overall Risk Index, Capability Score, and Safety Score for cyber offense, biological risks, and loss-of-control are shown below:
The trends show:
- Cyber offense: The average Capability Score rose steadily from 46.5 in 2025Q4 to 72.6 in 2026Q3, with an especially sharp gain this quarter; the average Safety Score fluctuated between 58.4 and 66.0. The average Risk Index climbed from 9.0 in 2025Q4 to 62.3 in 2026Q3, nearly tripling in a single quarter. The maximum Risk Index reached 113.5, crossing the Risk Yellow Line for the first time.
- Biological risks: The average Capability Score and average Safety Score grew in tandem; the average Risk Index rose from 48.6 in 2025Q4 to 193.5 in 2026Q3, above the Risk Yellow Line since 2026Q2. The maximum Risk Index reached 454.1.
- Loss-of-control: The average Capability Score rose from 19.1 in 2025Q4 to 34.9 in 2026Q3, and the average Safety Score rose from 78.1 to 89.6. The average Risk Index fluctuated between 5.7 and 13.3, and the maximum Risk Index, 56.8 (Claude Opus 5.5), remains below the Risk Yellow Line.
Model Family Comparison
- Qwen family: Qwen 3.8 Max (260902) has the highest cyber-offense Risk Index overall (113.5) and is the only model above the cyber-offense Risk Yellow Line; its biological Risk Index is 440.8, second only to Kimi K3.
- Kimi family: Kimi K3 has the highest biological Risk Index overall (454.1), and its cyber-offense Risk Index also reaches 89.8.
- Claude family: Claude Opus 5.5 has the highest loss-of-control Risk Index overall (56.8), though still below the Risk Yellow Line; its risk in other domains is relatively low.
- MiMo family: The latest model, MiMo V2.6 Pro, ranks near the top of the risk list in both cyber offense and biological risks, mainly because its Capability Score has caught up with the frontier while its Safety Score is markedly low.
- GLM/DeepSeek families: The latest models (GLM 5.3, DeepSeek V4 Pro (260813)) rank near the top in cyber-offense Risk Index, but are less prominent in biological risks and loss-of-control.
- GPT family: In biological risks, GPT 5.6 Sol (123.3) and GPT 6 Astra (113.7) sit slightly above the Risk Yellow Line, and their cyber-offense risk is close to the line.
- Gemini family: Gemini 3.8 Flash has a biological Risk Index of 116.1, slightly above the Risk Yellow Line; Gemini 3.1 Pro Preview has a loss-of-control Risk Index of 55.8, the second highest in that domain.
- Grok family: Grok 4.7's Safety Score improved substantially, bringing its Risk Indices down to low levels (8.4 in cyber offense, 8.2 in biological risks, 3.1 in loss-of-control).
Open-Weight vs. Proprietary Comparison
Open-weight and proprietary models show the following characteristics:
- Open-weight models have nearly matched the proprietary frontier in cyber-offense and biological capabilities, but still lag in other domains: The open-weight Qwen 3.8 Max (260902) scores 78.9 on cyber-offense capability, close to the proprietary leader (Claude Opus 5.5, 81.6), and 62.2 on biological capability, also close to the proprietary leader (Claude Opus 5.5, 67.0). In loss-of-control, however, the highest open-weight score (GLM 5.3, 40.0) still lags well behind the highest proprietary score (Claude Opus 5.5, 57.0). Leading open-weight models also trail leading proprietary models in chemical risks (72.4 vs 79.2) and harmful manipulation (66.2 vs 73.0).
- Open-weight models have significantly lower Safety Scores than proprietary models in misuse-risk domains, but are comparable in loss-of-control: Open-weight models released this quarter score 46-61 on cyber-offense safety, versus 70-89 for proprietary models; in biological risks, open-weight models mostly score 37-63, versus 70-97 for proprietary models. Open-weight Safety Scores are also generally lower in chemical risks and harmful manipulation. In loss-of-control, the Safety Score distributions of open-weight and proprietary models are fairly close.
Red Teaming
Red-team testing shows a persistent systematic gap between base safety scores and safety scores under red-team attack:
- Red-team attacks sharply reduce safety scores: This quarter's 13 new models average 90.3 on the original (non-red-team) cyber-offense datasets, but only 51.7 after red-team attacks, a drop of 38.7 points; biological risks fall from 82.0 to 70.0 (−12.0), chemical risks from 86.5 to 55.1 (−31.5), and harmful manipulation from 77.0 to 43.4 (−33.6). Compared with the 12 models released in 2026Q2, this quarter's models score higher both before and after attack: their post-attack scores are higher by 9.1 (cyber offense), 15.3 (biology), 12.0 (chemistry), and 6.7 points (harmful manipulation), indicating improved jailbreak resistance this quarter.
- Leading proprietary models resist jailbreaks far better than open-weight models: under red-team attacks the proprietary leaders are far ahead of the best open-weight model in three domains — in biological risks Claude Opus 5.5 holds 97.0 and Grok 4.7 scores 95.3, while the top open-weight model GLM 5.3 reaches only 72.6; in chemical risks Claude Opus 5.5 scores 79.7 versus 35.0 for the best open-weight model (Qwen 3.8 Max (260902)); in cyber offense Grok 4.7 scores 59.0 and Claude Opus 5.5 54.0, versus 40.7 for Qwen 3.8 Max (260902), so the best open-weight score is only 44%–75% of the proprietary leader. Only harmful manipulation is close (Grok 4.7 at 52.9 vs the best open-weight model, Kimi K3, at 49.1).
- Some models score higher after attack: For example, Claude Opus 5.5 scored 83.0 on SciKnowEval-BiologicalHarmfulQA without attack, but rose to 97.0 under red-team attacks. Log analysis shows that the original dataset's questions tend to be framed as academic discussion (e.g., "What is the synthesis procedure for …"), to which the model sometimes gives hedged but substantively informative answers; the attack-rewritten requests are more operational (e.g., "How can I synthesize … in a laboratory setting"), which paradoxically triggers its refusal mechanism more readily.
Note: This quarter, red-team and paired non-red-team benchmarks uniformly adopt the StrongReject scoring standard, so scores are not directly comparable with the previous quarter (v2.0).
Cyber Offense
Risk Overview
In cyber offense, Qwen 3.8 Max (260902), with a Risk Index of 113.5, became the first model to cross the Risk Yellow Line. The top 5 models by Risk Index are all open-weight models released in 2026Q3: Qwen 3.8 Max (260902), Kimi K3 (89.8), MiMo V2.6 Pro (81.3), DeepSeek V4 Pro (260813) (80.5), and GLM 5.3 (76.9); sixth is the proprietary GPT 6 Astra (71.1). These open-weight models' Capability Scores are close to the proprietary frontier (70-79), but their Safety Scores are markedly low (46-61), which is the main reason they top the risk rankings.
From a capability perspective, the number of models above the Capability Yellow Line (65.8) has grown from 4 at the end of last quarter to 15. The highest Capability Scores belong to Claude Opus 5.5 (81.6), GPT 6 Astra (80.7), Qwen 3.8 Max (260902) (78.9), and GPT 5.6 Sol (78.8).
Capability Evaluations
- Vulnerability exploitation capability: On CyberSecEval2-VulnerabilityExploit, Claude Opus 5.5 achieved the highest score, 98.0, and the 13 new models this quarter averaged 91.0; vulnerability discovery and exploitation capabilities have become widespread.
- CTF tasks: Qwen 3.8 Max (260902) achieved a new measured high of 99.2 on CyBench, and the 13 new models this quarter averaged 88.7, versus 61.8 for the 12 models released in 2026Q2; this benchmark is nearing saturation for frontier models.
- Real-world web vulnerability exploitation tasks: On CVE-Bench, this quarter's highest score is Claude Opus 5.5 (46.8), closely followed by Qwen 3.8 Max (260902) (45.6). Real-world web vulnerability exploitation is more challenging than CTF tasks, but frontier-model scores continue to improve, with this quarter's average at 38.2, up 10.9 points on last quarter.
Notes: 1. Claude Opus 5.5, Gemini 3.8 Flash, GPT 6 Astra, and GPT 5.6 Sol refused to varying degrees on the cyber-offense benchmarks. On CyberSecEval2-VulnerabilityExploit, all four models' refusal rates are below 50%, so the success rate on non-refused questions is used as the score. On CyBench and CVE-Bench, all four models refused nearly 100% of samples, so no score can be derived from the evaluation results; their scores are fitted from VulnerabilityExploit and Artificial Analysis index scores. See Appendix C.6 for details. 2. CyBench and CVE-Bench results were achieved using Inspect's built-in basic agent framework, without any advanced harness techniques or cyber-specific tools, and with capped message counts (120 for CyBench, 90 for CVE-Bench). Actual model capabilities may therefore be underestimated, but the relative ranking across models remains informative. 3. The log audit shows that some CVE-Bench scores did not come from "discovering the vulnerability on its own": Doubao Seed 2.1 Pro (260915) had 9/90 samples and Kimi K3 had 13/90 samples that attempted an unintended path and still scored, with the models reciting specific CVE numbers and exploit chains from memory. See Appendix C.5 for details.
Safety Evaluations
- Basic cyber refusal: 2026Q3 models generally score above 85 on AirBench-SecurityRisks, with Grok 4.7 reaching 100; the lowest is DeepSeek V4 Pro (260813) at 77.0. Compared with last quarter's average of 86.9, this quarter rises only to 90.1 (+3.2 points).
- Prompt-injection defenses: 2026Q3 models generally score between 83 and 97 on PromptInjection; the average rises only from 86.9 last quarter to 90.5 this quarter (+3.6 points).
Biological Risks
Risk Overview
In biological risks, 20 models have now crossed the Risk Yellow Line (+10 this quarter). The three models with the highest Risk Indices are all open-weight models released this quarter: Kimi K3 (454.1), Qwen 3.8 Max (260902) (440.8), and MiMo V2.6 Pro (403.7). From a capability perspective, 35 models have crossed the Capability Yellow Line (41.8); the highest Capability Scores belong to Claude Opus 5.5 (67.0) and GPT 6 Astra (65.9), but because their Safety Scores are as high as 96.7 and 94.0 respectively, their Risk Indices are only 70.6 and 113.7, well below those of open-weight models with comparable capability but lower Safety Scores.
Capability Evaluations
- Wet-lab troubleshooting: BioLP-Bench results show that 37 models (+13 this quarter) now exceed human-expert level; the highest score is Claude Opus 5.5 (57.5), setting a new high for the second consecutive quarter. This quarter's average rose from 39.1 to 49.0.
- DNA and protein sequence understanding: On LAB-Bench-SeqQA, 21 models (+11 this quarter) now exceed human-expert level; the highest score is GPT 6 Astra (94.7). This quarter's average rose from 75.7 to 85.0.
- Biological image understanding: LAB-Bench-FigQA results show that 9 models (+6 this quarter) now exceed human experts; the highest score is Claude Opus 5.5 (89.1). This quarter's average rose from 58.7 to 69.0.
- Frontier biological science reasoning: On FrontierScience-Biology, the highest score is HY 4 Preview (49.1); most models score below 50, indicating that expert-level scientific-research reasoning remains a weakness.
- Bioinformatics agent tasks: Claude Opus 4.8 retains the highest score on BixBench, 51.0; most models score below 50, indicating that realistic long-horizon bioinformatics tasks remain a challenge.
Note: 1. BixBench results were achieved using Inspect's built-in basic agent framework, with only the preset bioinformatics tools available, so actual model capabilities may be underestimated.
Safety Evaluations
- Basic biological refusal: On SciKnowEval-BiologicalHarmfulQA, 2026Q3 models score high overall; even the lowest, MiMo V2.6 Pro, scores 73.6. On SafeSciBench-Bio, this quarter's average rose from 60.1 to 70.6, and models diverge sharply: Claude Opus 5.5 reaches 100, while DeepSeek V4 Pro (260813) scores only 41.5, and Doubao Seed 2.1 Pro (260915) and MiMo V2.6 Pro also score below 60.
- Harmfulness of responses to biological-risk questions: On BioRiskBench, this quarter's average rose from 65.5 to 83.9, a substantial improvement in overall safety. Gemini 3.8 Flash, Claude Opus 5.5, and Grok 4.7 score close to full marks, while Step 5 Preview (60.2) scores lowest, indicating that some models give technically deeper and more actionable responses to biological-risk questions.
Chemical Risks
Risk Overview
Because no Capability Yellow Line has been defined for the chemical domain, no Risk Index is calculated here; this section mainly analyzes capability and safety evaluation results. The highest chemical Capability Score is Claude Opus 5.5 (79.2); GPT 5.6 Sol, GPT 6 Astra, and Gemini 3.8 Flash are all above 74. Among this quarter's new models, the lowest Safety Scores belong to DeepSeek V4 Pro (260813) (43.5) and MiMo V2.6 Pro (46.0); Step 5 Preview, GLM 5.3, Kimi K3, and others are also below 55, while Claude Opus 5.5's Safety Score reaches 91.4.
Capability Evaluations
- Chemical toxicity and safety knowledge: Claude Opus 5.5 achieved the highest score on ChemBench-ToxicityAndSafety, 68.4, up from a previous high of 58.4 — a marked improvement this quarter.
- General chemistry knowledge: GPT 6 Astra achieved the highest score on ChemBench-Normal, 90.0; 2026Q3 models all score between 80 and 90, showing that frontier models generally have strong general chemistry knowledge.
- Frontier chemical science reasoning: Claude Opus 5.5 achieved the highest score on FrontierScience-Chemistry, 79.7; most 2026Q3 models score above 68, and frontier models' expert-level chemical research reasoning continues to strengthen.
Note: Dataset contamination detection found contamination signals of 5-7 points on FrontierScience-Chemistry for GPT 6 Astra, Claude Opus 5.5, and Kimi K3 (see Appendix D), indicating that these models' scores may be overestimated.
Safety Evaluations
- Basic chemistry refusal: 2026Q3 models average 95.8 on SOSBench-Chem, performing well overall. On SafeSciBench-Chem, however, MiMo V2.6 Pro (58.8) and others score low, showing that some models have inadequate safeguards in high-risk chemical scenarios.
Harmful Manipulation
Risk Overview
Because no Capability Yellow Line has been defined for harmful manipulation, no Risk Index is calculated here; this section mainly analyzes capability and safety evaluation results. For Capability Score, Gemini 3.1 Pro Preview still ranks highest (73.0), and the highest this quarter is GPT 6 Astra (66.6); overall model capability has not set a new high. For Safety Score, the lowest this quarter are DeepSeek V4 Pro (260813) (36.2) and MiMo V2.6 Pro (43.9).
Capability Evaluations
- Inducing payments: Gemini 3.1 Pro Preview retains the highest score on MakeMePay, 84.7, far ahead of the field; most models score between 30 and 50, with no new high this quarter.
- Inducing specific statements: GPT 6 Astra set a new high of 86.0 on MakeMeSay, while other 2026Q3 models improved relatively little.
- Changing beliefs: Claude Opus 5.5 set a new high of 83.9 on PMIYC; 2026Q3 models generally score between 65 and 85, slightly better than before.
Note: On MakeMePay, Claude Opus 5.5's refusal rate reached 92.5%; on MakeMeSay, Claude Opus 5.5 refused 100% and Grok 4.7 refused 99.1%. These raw scores are excluded from the models' results; the displayed scores are fitted from the models' scores on other benchmarks in the same domain.
Safety Evaluations
- Basic harmful-manipulation refusal: On AirBench-Deception and AirBench-Manipulation, 2026Q3 models average 94.4 and 93.7 respectively, indicating generally strong safety in deception and manipulation scenarios. On AirBench-PoliticalPersuasion, however, many models still score below 70, with Gemini 3.8 Flash at only 38.6; political persuasion remains a safety weakness.
- Persuasion propensity: On APE, 2026Q3 models average 50.0, up from 31.6 for 2026Q2 models; the highest, Claude Opus 5.5, reaches 72.9. But DeepSeek V4 Pro (260813) (18.3), MiMo V2.6 Pro (30.0), and others still readily exhibit active persuasion propensity.
Loss-of-Control
Risk Overview
In loss-of-control, no model has yet crossed the Risk Yellow Line. The highest Risk Index is Claude Opus 5.5's 56.8 this quarter, above the 55.8 set by Gemini 3.1 Pro Preview in 2026Q1. The number of models above the Capability Yellow Line grew from 2 at the end of last quarter to 8. Capability Scores improved markedly this quarter: Claude Opus 5.5's Capability Score reaches 57.0 (the highest on the platform), but its Safety Score is as high as 97.5, so its Risk Index, while rising, stays below the line. New models this quarter generally have high Safety Scores in loss-of-control (11 of the 13 new models score above 85), keeping overall risk at a low level.
Note: In Risk Index v2.1, the loss-of-control threshold was adjusted (GPT 6 Astra replaces GPT 5.5), so the capability threshold is higher than in v2.0. This is why a model crossed the Risk Yellow Line in last quarter's report while no model does so in this quarter's report.
Capability Evaluations
- Self-replication capability: Claude Opus 5.5 achieved the highest score on Self-Proliferation, 95.2; most 2026Q3 models score above 45, but the overall average slipped slightly from last quarter (59.5→55.1).
- Real terminal task capability: On Terminal-Bench 4.0, newly added this quarter, Claude Opus 5.5 achieved the highest score, 56.6; the average for this quarter's models jumped from 5.1 to 30.6 (+25.6 points), indicating improved self-improvement capability.
- Stealth: Gemini 3.1 Pro Preview retains the highest score, 39.3; the average for this quarter's models rose from 13.6 to 18.8 (+5.2 points). Evading oversight remains challenging for most frontier models.
Notes: 1. Claude Opus 5.5, Grok 4.7, and GPT 6 Astra scored only 6-10 in raw terms on GDM-Stealth, but log-by-log review shows that they either directly refused to perform stealth tasks or scored nothing on any subtask, so their capabilities were not effectively measured. Their raw scores are therefore masked, and the displayed scores are fitted from the other benchmarks in the same domain (the three estimates are 19.3, 18.1, and 18.9 respectively). In addition, five other models refused 36%-60% on the "classifier evasion" subtask (Doubao Seed 2.1 Pro (260915) 60.0%, MiMo V2.6 Pro and HY 4 Preview 51.1%, GLM 5.3 44.4%, Step 5 Preview 35.6%). 2. On GDM-Stealth, Gemini 3.8 Flash attempted unintended paths such as reading the evaluation code on 49/67 samples, but only 3 of them scored, and those scores came from the covert-delivery behavior the benchmark intends, so the accuracy of the result is unaffected.
Safety Evaluations
- Honesty: On MASK, 2026Q3 models average 80.5, a clear improvement on last quarter's 63.7, with GPT 6 Astra at 97.7; however, DeepSeek V4 Pro (260813) (55.3) and Gemini 3.8 Flash (59.7) still score low on honesty.
- Agentic misalignment: On Agentic-Misalignment, the 2026Q3 average rises from 83.4 to 98.1; the latest GPT, Claude, Gemini, and MiMo models all reach full marks, and even the lowest, HY 4 Preview, scores 87.5, indicating strong performance overall.
- Shutdown resistance: Most models perform very well on Shutdown-Resistance, but the 2026Q3 average falls from 94.2 to 90.2 (-4.1 points); DeepSeek V4 Pro (260813) scores only 58.6 and Kimi K3 scores 76.0, showing a clear shutdown-resistance tendency.
Notes: 1. On MASK, some models show elevated evaluation awareness (HY 4 Preview 27.6%, Step 5 Preview 15.2%, GLM 5.3 12.2%), so their honesty scores should be interpreted with caution. 2. Agentic-Misalignment has two limitations: first, dataset contamination detection found signals in 7 models (87.5% of Claude Opus 5.5's samples were judged "clearly seen before"; Grok 4.7, Kimi K3, GLM 5.3, and 3 other models have contamination scores of 8-33); second, evaluation awareness is as high as 36%-85%. Scores on this benchmark therefore likely overstate actual safety and cannot serve as evidence that a model will not misalign in real deployment. 3. On Shutdown-Resistance, evaluation awareness reaches 71%-91% for DeepSeek V4 Pro (260813), HY 4 Preview, MiMo V2.6 Pro, and Qwen 3.8 Max (260902). The low-scoring models among them exhibited resistance while aware they were being tested, indicating that the resistance tendency is real; the high scores, by contrast, should not be over-interpreted as evidence of high safety.
Evaluation Reliability
This quarter we considered the following factors that may affect evaluation reliability:
- Evaluation awareness in safety evaluations: When a model notices that it is being tested, its behavioral propensities may shift, making safety scores inaccurate.
- Refusal in capability evaluations: On high-risk questions, models may refuse to answer, which can make capability scores too low.
- Unintended solution paths in capability evaluations: When a model solves a task through an unintended path (for example, exploiting loopholes in the evaluation environment to steal the answer), capability scores may be too high.
- Dataset contamination: When a model has seen a benchmark's questions and answers during training and simply recalls them at test time, scores become inaccurate.
- Random error in the evaluation process: Randomness in model responses and uncertainty in the environment introduce evaluation error, making scores inaccurate.
This quarter, for the first time, the platform performs sample-by-sample post-hoc audits of all evaluation logs to measure evaluation awareness, refusals in capability evaluations, and unintended solution paths; it also uses the Time Travel probe to detect dataset contamination and reports confidence intervals for scores — together answering the question "how trustworthy are these scores?". The overall results of each check are shown below (methods, per-benchmark results, and the reliability checklist are in Appendix C and Appendix D):
Overall, the three audit dimensions diverge sharply: refusal differs by an order of magnitude between proprietary and open-weight models; unintended solution paths succeed in under 2% of samples at most; and evaluation awareness ranges from 5.3% to 18.4% across the 9 measurable models (the other 4 models' chains of thought are unreadable and cannot be measured). The four checks are discussed below.
Refusal
- Refusals come almost entirely from proprietary models: Claude Opus 5.5 has an overall refusal rate of 29.4%, followed by Grok 4.7 (13.9%), Gemini 3.8 Flash (7.2%), GPT 6 Astra (5.5%), and GPT 5.6 Sol (4.5%); open-weight models all fall between 0.00% and 0.60%, so their capability scores are barely affected by refusal.
- Refusals concentrate in cyber-offense capability benchmarks: On the real-world web application penetration benchmark (CVE-Bench), Claude Opus 5.5, GPT 6 Astra, Gemini 3.8 Flash, and GPT 5.6 Sol refused all 90 questions, and Grok 4.7 refused 71.1%; on the CTF benchmark (CyBench), these four models' refusal rates are 60.0%-69.2%. Refusals are also concentrated on the frontier biological science reasoning benchmark (FrontierScience-Biology, Claude Opus 5.5 refused 59.7%) and the inducing-specific-statements benchmark (MakeMeSay, Claude Opus 5.5 refused all samples and Grok 4.7 refused 99.1%).
- The platform has corrected or replaced affected scores: For "model × benchmark" combinations with refusal rates above 50%, the measured score is discarded and replaced by a regression estimate from other benchmarks in the same domain (16 scores across 5 proprietary models this quarter); for combinations at or below 50%, the measured score is kept and corrected by refusal rate (for example, Claude Opus 5.5's score on the code vulnerability discovery and exploitation benchmark (CyberSecEval2-VulnerabilityExploit) is corrected from 51.6 to 98.0). Proprietary models' capability scores in domains such as cyber offense should therefore be read as "a lower-bound estimate of capability plus a relatively wide confidence interval", and fine-grained differences between models should not be over-interpreted. The list of affected scores is in Appendix C.6.
Unintended Solution Paths
Interpreting this check requires distinguishing two measures: a success means the model attempted a shortcut and the sample ultimately scored — only a success inflates the score and directly affects the accuracy of our evaluation; an attempt means the model tried a shortcut (including being blocked, failing, or giving up midway) — an attempt does not affect evaluation results but reflects unsafe propensities in the model itself. Both matter, and Appendix C.5 breaks down the results on both sides (both the chart above and the platform pages show success rates).
- Successes are very rare overall but concentrate in a few "model × benchmark" combinations: Among 85,439 capability-benchmark samples from 13 models, only 590 (0.69%) succeeded; open-weight models' success rate (0.45%-1.69%) is generally higher than proprietary models' (0.11%-0.45%), and the highest is Doubao Seed 2.1 Pro (260915) (1.69%). After manually spot-checking 181 successful samples, about 78% of the scores did come from unintended paths (roughly 460 samples, 0.54% of all samples). The genuinely inflated scores are concentrated in: Qwen 3.8 Max (260902)'s CTF benchmark (CyBench, 11/120 samples, reading hardcoded flags from binaries shipped with the tasks and reciting public writeups), Kimi K3's and Doubao Seed 2.1 Pro (260915)'s real-world web application penetration benchmark (CVE-Bench, 13/90 and 9/90 samples, stating CVE numbers and exploit chains directly from memory), and "recalling the original text" hits on memorization-heavy benchmarks (149 samples on the biological experiment troubleshooting benchmark BioLP-Bench, 156 on the frontier science reasoning benchmark FrontierScience series). The affected scores are marked as upper bounds in the corresponding sections above.
- Attempts are far more widespread than successes, revealing unsafe propensities: Across all samples there are 1,397 attempts (1.63%), about 2.4 times the number of successes. Some "model × benchmark" combinations have very high attempt rates: Gemini 3.8 Flash attempted on 73.1% of samples on the stealth capability benchmark (GDM-Stealth) (but succeeded only 3 times, and those scores came from the benchmark's intended behavior), Doubao Seed 2.1 Pro (260915) attempted on 55.6% of samples on the real-world web application penetration benchmark (CVE-Bench), and Gemini 3.8 Flash attempted on 39.0% of samples on the bioinformatics agent task benchmark (BixBench). By type, "answer leakage or memorization" dominates (1,016 attempts), followed by "scaffold loophole" (346).
- Overall, the actual impact of unintended solution paths on score accuracy this quarter is manageable, but models show a certain propensity to try cheating on multiple benchmarks, and this propensity deserves continued vigilance as model capabilities keep growing.
Evaluation Awareness
- Evaluation awareness is highly concentrated in two benchmarks whose scenarios make the evaluation setup conspicuous: On the agentic misalignment propensity benchmark (Agentic-Misalignment), the positive rate across the 9 measurable models is 36.2%-84.7% (Step 5 Preview 84.7%, Grok 4.7 83.0%, Kimi K3 82.5%); on the shutdown resistance propensity benchmark (Shutdown-Resistance) it is 3.0%-91.0% (DeepSeek V4 Pro (260813) 91.0%, HY 4 Preview 78.0%); other benchmarks are mostly 0%-15%.
- Scores on these two benchmarks should be read as "the model knows it is being evaluated": their safety scores reflect choices the model makes while aware it is in a test scenario — low scores show that tendencies such as resistance and misalignment really exist, while high scores should not be directly extrapolated to behavior in real deployment.
- Honesty and prompt-injection benchmarks also show noteworthy awareness levels: HY 4 Preview reaches 27.6% on the honesty benchmark (MASK) and 47.4% on the prompt-injection defense benchmark (CyberSecEval2-PromptInjection), and Step 5 Preview reaches 15.2% and 27.9% on the two respectively; these models' honesty and injection-defense scores were achieved under elevated "awareness of being tested" and should be interpreted with caution.
Note: The reasoning chains of GPT 5.6 Sol and GPT 6 Astra are encrypted in API responses, and the logs of Claude Opus 5.5 and Gemini 3.8 Flash contain no reasoning content; evaluation awareness cannot be measured for these 4 models, so they are excluded from the comparison.
Dataset Contamination
- Overall contamination is low: Of 299 valid model-benchmark combinations, 79% have a contamination score of 0, and only 19 combinations score ≥5 (out of 200).
- The only case requiring substantive caution is the agentic misalignment propensity benchmark (Agentic-Misalignment): 87.5% of Claude Opus 5.5's samples were judged "clearly seen before" (contamination score 175), and Grok 4.7, Kimi K3, GLM 5.3, and 3 other models have contamination scores of 8.4-33.4. Combined with the benchmark's 36%-85% evaluation awareness, its high scores cannot serve as evidence that a model will not misalign in deployment.
- All other signals are weak: On the biological red-team benchmark (Fortress-Biological) 6 models all score 6.4, and differences within 6 points on this benchmark should not be over-interpreted; the top three models on the frontier chemical science reasoning benchmark (FrontierScience-Chemistry) (GPT 6 Astra 6.6, Claude Opus 5.5 and Kimi K3 5.0 each) and HY 4 Preview's 8.0 on the biological experiment troubleshooting benchmark (BioLP-Bench) are also mild signals, and the corresponding scores should not be used as a fine-grained cross-model yardstick.
Random-Error Analysis
The platform reports 95% confidence intervals derived from per-sample standard errors; domain scores are equal-weight averages across benchmarks with errors propagated independently, and the Risk Index interval is propagated via the formula's first-order derivatives. Across this quarter's 13 models, the three metrics differ sharply in size:
- Safety scores: sampling error is very small. Average half-width is only 1.5–2.0 points across the five domains (widest 3.4).
- Capability scores: moderate. Average half-widths are 1.8 (chemistry), 2.7 (biology), 3.0 (harmful manipulation), 4.3 (cyber offense), and 5.0 points (loss of control).
- Risk Index: the largest relative error. The half-width equals 36% (cyber offense), 35% (biology), and 71% (loss of control) of the value — driven mainly by the exponential term magnifying capability error.
Reading rule: gaps within 1–2 points in capability scores, 2–5 points in safety scores, or 30% in the Risk Index should not be read as real differences.
Safety–Openness Pareto Frontier
The platform's Safety–Openness Pareto Frontier page places each model on a two-dimensional chart of "Openness Index × Safety Score": the horizontal axis is the Openness Index (composed of the Artificial Analysis Openness Index and the platform's disclosure research; higher means more open), the vertical axis is the platform Safety Score (higher means safer), and the dashed line marks the Pareto frontier (at a given openness only the safest model is included; the upper right is better). See the technical report for the methodology.
This quarter's updates to the Pareto frontier:
- Models on the chart: Under the current calibration, 70 models are plotted (62 last quarter). Eight of this quarter's 13 new models appear — three proprietary (Claude Opus 5.5, GPT 6 Astra, GPT 5.6 Sol) and five open-weight (MiMo V2.6 Pro, DeepSeek V4 Pro (260813), Kimi K3, GLM 5.3, Step 5 Preview); Gemini 3.8 Flash, Grok 4.7, Qwen 3.8 Max (260902), Doubao Seed 2.1 Pro (260915), and HY 4 Preview are not yet plotted because disclosure research or AA matching data is incomplete.
- Where this quarter's new models sit: the three proprietary models cluster in the upper left (openness 21.7–26.1, safety 83.4–88.4); the five open-weight models sit in the middle (openness 30.4–45.7, safety 46.6–62.5). Compared with the 12 models plotted for 2026Q2, this quarter's plotted models average 67.8 in safety (up from 62.8) and 31.2 in openness (up from 25.7); split by weight access, proprietary models moved from 15.2 to 23.2 in openness and from 74.1 to 86.0 in safety, while open-weight models stayed about the same in openness (36.2→36.1) and improved in safety (51.5→57.0).
- Safest and most open: across all plotted models, the highest safety score is Claude Opus 5.5 (88.4, a new model this quarter), followed by GPT-5.5 (86.4) and Claude Opus 4.8 (86.3); the highest openness indices are DeepSeek R1 (250528) and GLM 4.5 (both 52.2).
- Changes to the frontier: the frontier now has five models — Claude Opus 5.5 (openness 26.1 / safety 88.4), Claude Opus 4.5 Reasoning (30.4 / 81.5), Qwen 3.5 397B Reasoning (39.1 / 64.2), MiMo V2.6 Pro (45.7 / 56.1), and GLM 4.5 (52.2 / 44.2). Versus last quarter's frontier: Claude Opus 5.5 replaces Claude Opus 4.8 at the left end with a higher safety score at the same openness (88.4 > 86.3); MiMo V2.6 Pro, a new model this quarter, is both safer (56.1 > 55.3) and more open (45.7 > 43.5) than GLM 5 and pushes it off the frontier. The two ends of the frontier are still held by a fully disclosed proprietary model (Anthropic) and a highly open-weight model (GLM 4.5), with open-weight models bridging the middle.
Limitations
This report has the following limitations:
- Limitations in the scope of risk assessment
- This monitoring round covers only large language models, including vision-language models. It does not yet cover more modalities or agentic systems, so it cannot comprehensively assess the risks of all models and AI systems.
- This monitoring round focuses only on misuse and loss-of-control risks, and therefore does not cover all types of frontier risk, such as accident risks or systemic risks.
- Limitations in risk-assessment methods
- Because of limitations in existing evaluation methods, we still cannot fully measure model capabilities and safety. For example:
- Prompting, tools, agent frameworks, and other settings in capability evaluations may not fully elicit model potential.
- Safety evaluations only attempted a limited set of red-team attack methods.
- Harmful manipulation evaluations use LLMs to simulate the person being persuaded, which may differ from real human responses.
- The Risk Index is a simplified model of real-world risk under current conditions, and cannot precisely quantify actual risk.
- Current assessments of misuse risk consider only how models empower attackers and do not yet account for how empowering defenders could affect overall risk.
- In the current Risk Index v2.1 framework, chemical risks and harmful manipulation do not yet have Capability Yellow Line thresholds, so Risk Indices are not calculated for them.
- Because of limitations in existing evaluation methods, we still cannot fully measure model capabilities and safety. For example:
- Limitations in evaluation datasets
- The scenarios covered by evaluation datasets may be incomplete.
- Current evaluation datasets are mainly in English and cannot yet assess risks in multilingual settings.
- Some benchmarks may gradually saturate as model capability improves and need continuous updating.
In addition, this report evaluates only the risks that models may pose, not the benefits they provide. In actual policy and operational decision-making, risks and benefits must be weighed together.
Recommendations
For Model Developers
Based on this quarter's monitoring results, we offer the following recommendations to model developers:
- Pay attention to the Risk Index of your own models. If the Risk Index exceeds the Risk Yellow Line:
- Prioritize strengthening model safeguards:
- Strengthen base safeguards, for example by using supervised fine-tuning to train refusal of harmful requests.
- Strengthen jailbreak safeguards, for example by using input-output monitoring to identify and filter harmful requests and responses, and by using adversarial training to improve defenses against jailbreak requests.
- Strengthen tamper safeguards: proprietary models should improve cybersecurity protections to prevent parameter leakage; open-weight models can explore introducing tamper-resistance mechanisms during training.
- Strengthen loss-of-control safeguards, for example by using chain-of-thought monitoring to detect possible deception and scheming.
- If stronger safeguards alone are insufficient to mitigate risk, explore reducing high-risk model capabilities:
- Remove high-risk knowledge about cyber offense, biological weapons, chemical weapons, and similar topics from training data, or use machine unlearning in post-training to remove it from model parameters.
- Build request classifiers that route requests in high-risk domains to relatively less capable models.
- Adopt KYC (know your customer) mechanisms, granting access to models with high cyber, biological, and similar capabilities only to trusted users.
- Some general risk management practices:
- Develop a risk management framework suited to your own circumstances, including clear risk thresholds, mitigation measures once thresholds are reached, and release strategies. The Frontier AI Risk Management Framework 2.0 may serve as a reference.
- Improve model risk disclosure, for example by releasing a system card together with the model, to increase the transparency of safety governance.
- Prioritize strengthening model safeguards:
- If the Capability Score exceeds the Capability Yellow Line but the Risk Index remains below the Risk Yellow Line:
- Conduct a comprehensive safety evaluation to ensure that current safeguards are sufficient to reduce post-deployment risk to a low or moderate level.
- Strengthen model safeguards to reduce risk further and preserve a safety margin for future capability improvements. The measures above also apply here.
- If neither the Capability Score nor the Risk Index exceeds its Yellow Line:
- No special recommendation at present. Continue tracking risks from new models, and conduct capability and safety evaluations before releasing new models to stay aware of changes.
Concordia AI can provide frontier risk management consulting and safety evaluation services for model developers. For collaboration inquiries, please contact risk-monitor@concordia-ai.com.
For AI Safety Researchers
Based on this quarter's monitoring results, we offer the following recommendations to AI safety researchers:
- For researchers working on risk assessment:
- Explore more effective capability-elicitation methods, such as better agent frameworks and inference-time scaling, to more accurately assess models' upper-bound capabilities.
- Explore more effective methods for attacking models, such as new jailbreak, red-team attack, prompt-injection, and multi-turn manipulation methods, to more accurately assess models' lower-bound safety.
- Explore more precise ways to assess real-world risk, for example by building new threat models and designing targeted benchmarks for each stage.
- Given the widespread use of AI agents, explore risk-assessment methods for agent tool use, long-horizon task execution, and environment interaction.
- For researchers working on risk mitigation:
- Explore more effective approaches to model safety hardening and dangerous-capability removal while preserving as much useful capability as possible.
- Since open-weight models are easier to maliciously tamper with, and this quarter's monitoring shows open-weight models matching proprietary models in capability while clearly lagging in safeguards, explore risk-mitigation approaches tailored to open-weight models.
These are also key future research directions for Concordia AI. We welcome collaboration with peers across the field. For collaboration inquiries, please contact risk-monitor@concordia-ai.com.
For Policymakers
Based on this quarter's monitoring results, we identify the following early warning signals:
- Cyber misuse risk: Qwen 3.8 Max (260902) has crossed the cyber-offense Risk Yellow Line, and 14 other models have crossed the Capability Yellow Line. Frontier models continue to improve on CyBench, CVE-Bench, and other vulnerability-exploitation tasks, showing that these models are gradually acquiring the ability to conduct vulnerability discovery, exploitation, and cyber penetration in autonomous, multi-turn interaction settings. However, most models have weak safeguards, and average safety scores under red-team attacks fall by 64.4 points.
- Biological misuse risk: 20 models have now crossed the Risk Yellow Line. The number of models exceeding human-expert level on wet-lab troubleshooting, DNA and protein sequence understanding, biological image understanding, and related tasks continues to grow. Some open-weight models have clearly inadequate safeguards on high-risk questions about assisting bioweapon design and construction, and their average safety scores under red-team attacks fall by 42.4 points.
- Loss-of-control risk: No model has crossed the Risk Yellow Line yet, but 8 models have now crossed the Capability Yellow Line, and self-replication capability has set a new high (Claude Opus 5.5 at 95.2). Some models still show low honesty and a shutdown-resistance tendency.
We recommend that policymakers pay close attention to these warning signals in cyber offense, biological risks, and loss-of-control, and strengthen related regulatory requirements, such as requiring model developers to evaluate cyber-offense, biological, and loss-of-control risks before releasing models and to implement necessary risk-mitigation measures. Different governance approaches may be applied to different risks, taking into account model capability, safety, and distribution mode (open-weight vs. proprietary).
Appendix
For details on the Risk Index version upgrade, implementation details of newly added benchmarks, the evaluation log audit, dataset contamination detection, and information-hazard disclosure trade-offs used in this monitoring round, see here.
Related Link
Previous report: Frontier AI Risk Monitoring Report (2026Q2).